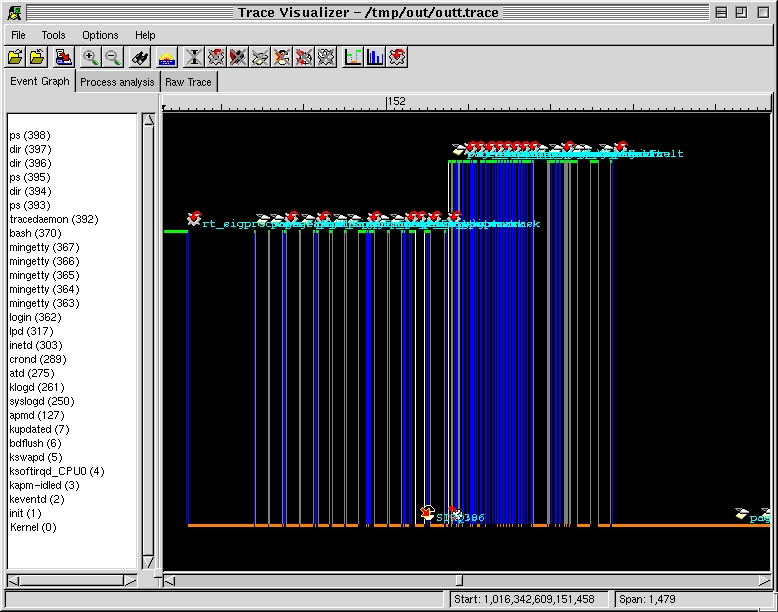
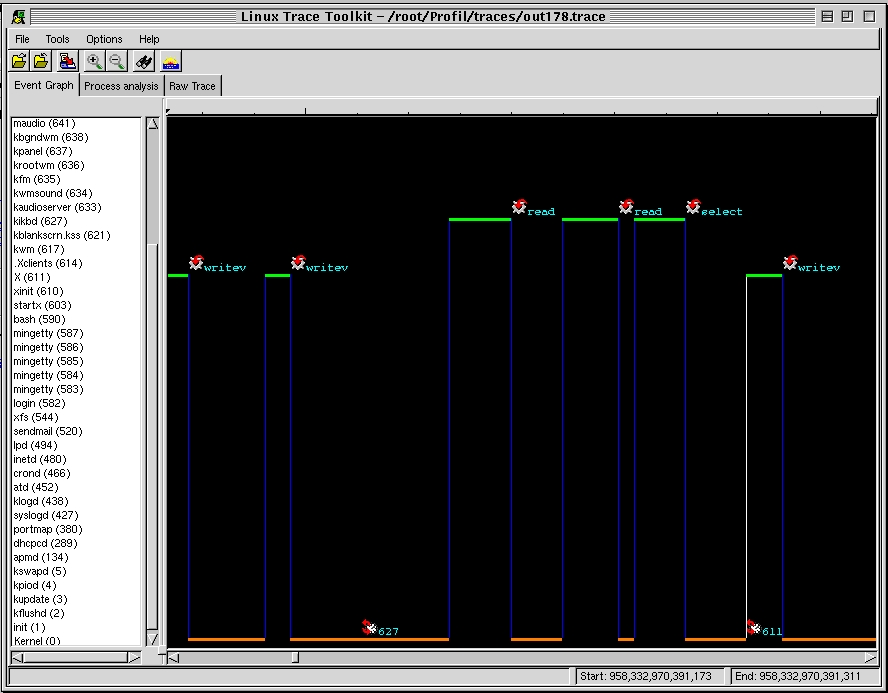
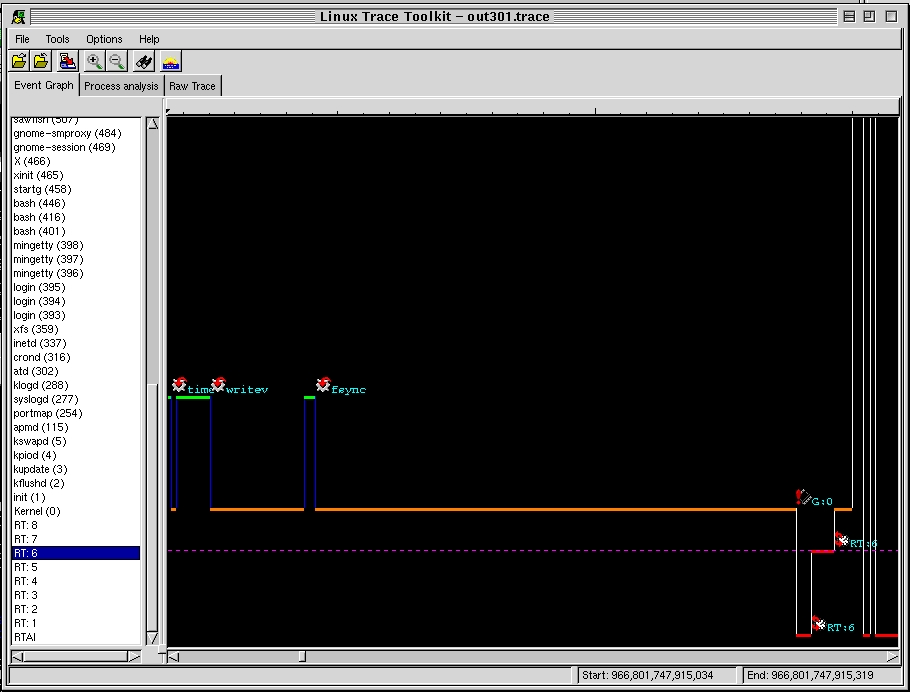
The event graph provides the viewer with a unique perspective on the flow of events in the system. Every control modifiying event modifies the flow of the graph. A vertical line marks a shift of control from or to the kernel. A horizontal line marks a time lap during which a process or the kernel was executing. Blue vertical lines are either an entry or an exit to a system call. Grey vertical lines mark entry of exit from a trap. White line mark entry or exit by way of interrupt. Orange horizontal line marks time spent in the kernel. Green horizontal time marks time spent in a process.
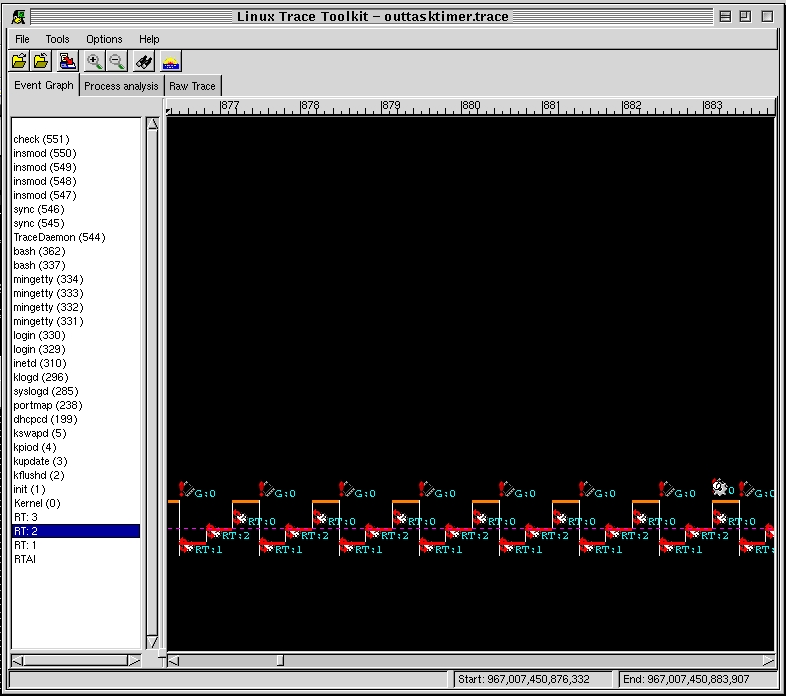
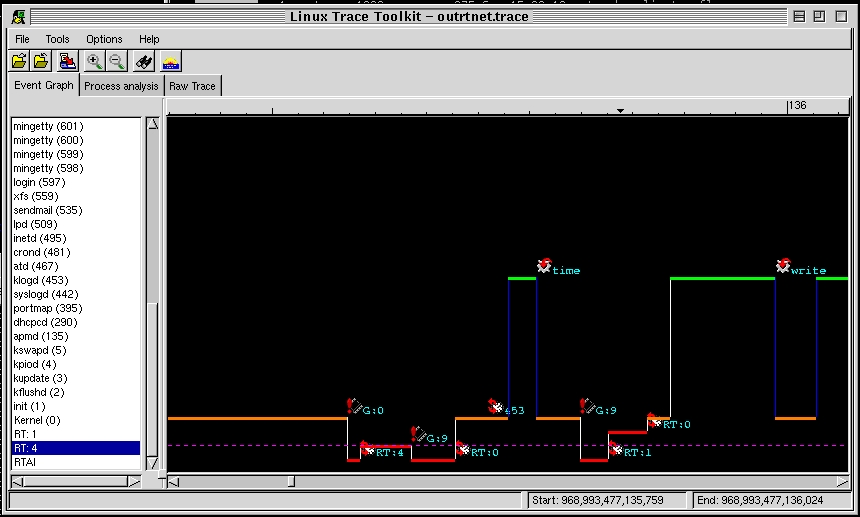
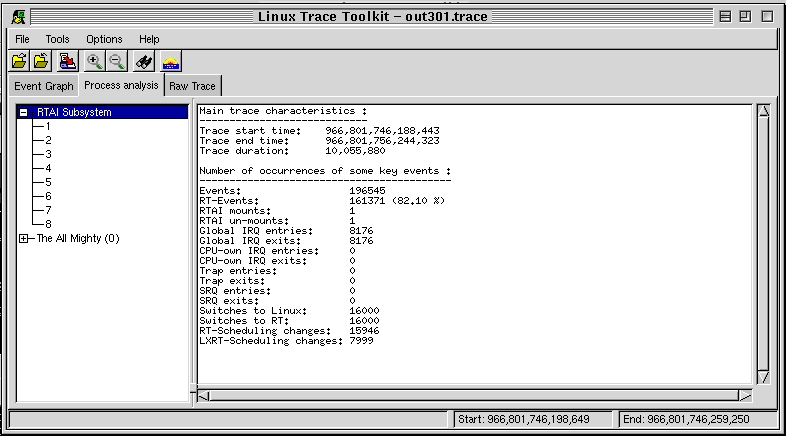
In the case of traces containing RTAI data, the transitions into and out of the RTAI core and RTAI tasks are marked by white vertical lines. Time spent within a real-time component is always drawn in red.
Events, whether they modify the control flow or not, can be accompanied by text and an icon in order to detail them. The meaning of the text and icon is detailed in the documentation section of this web page.
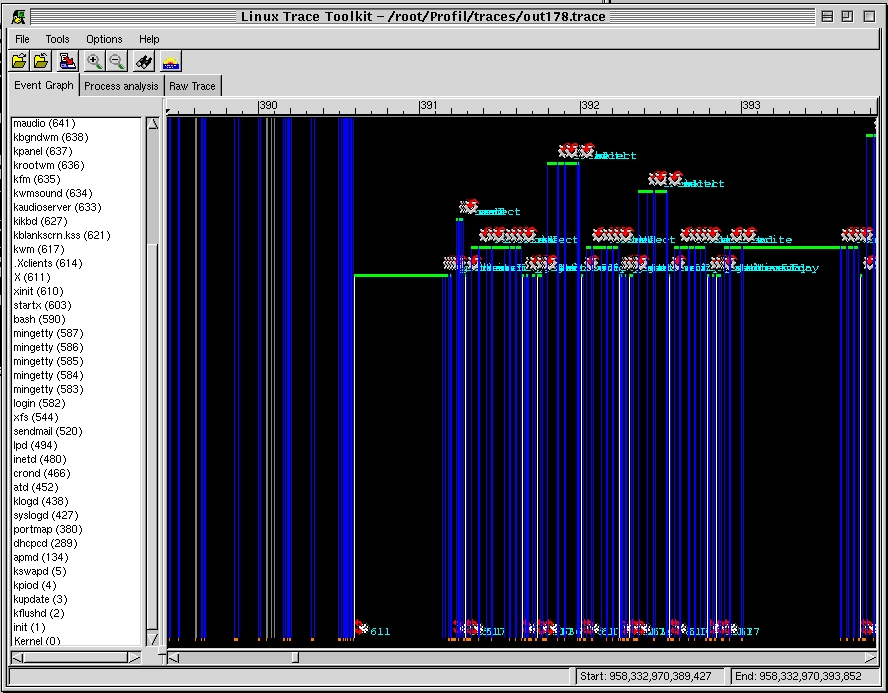
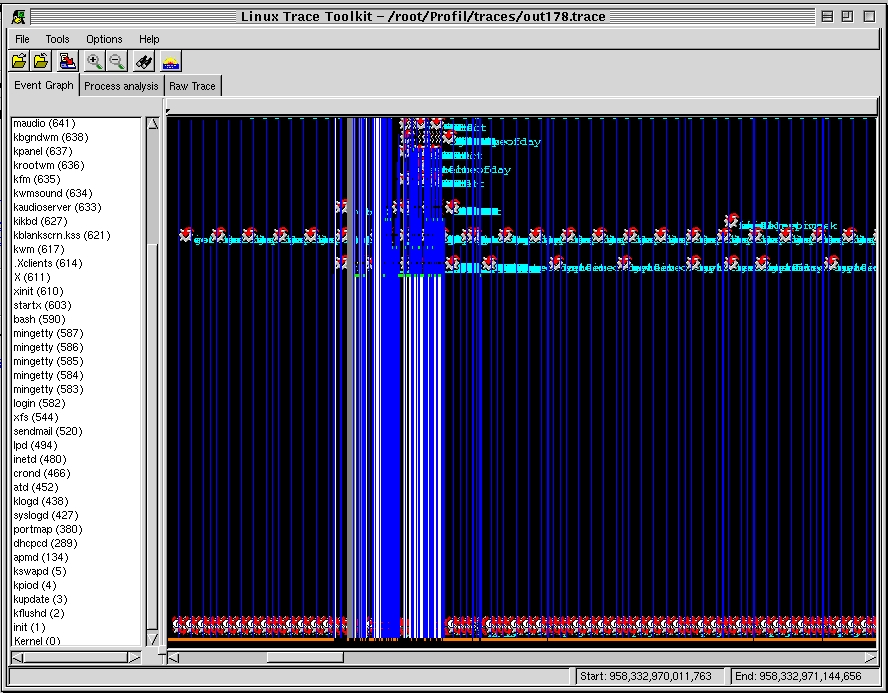
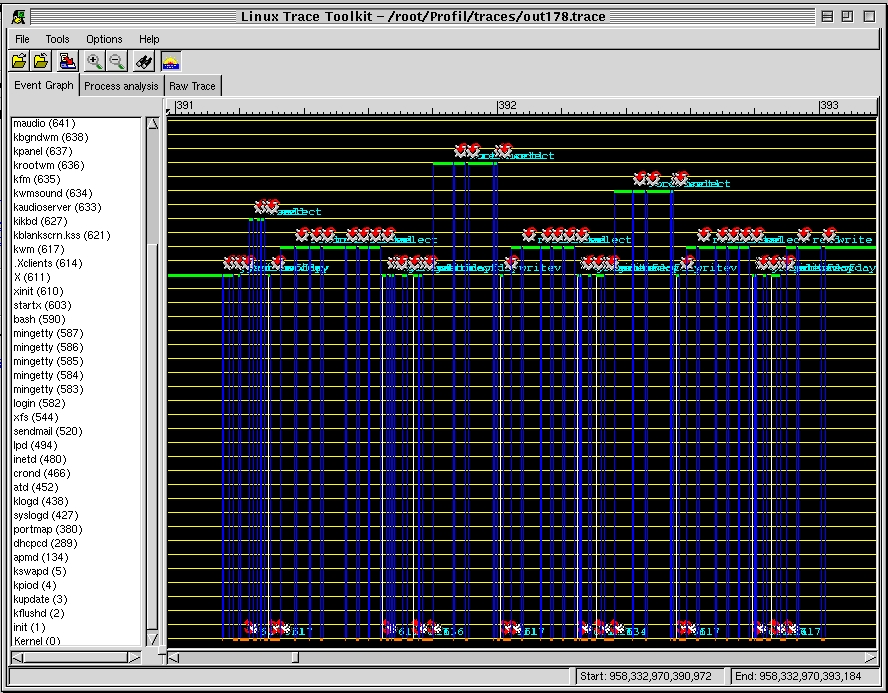
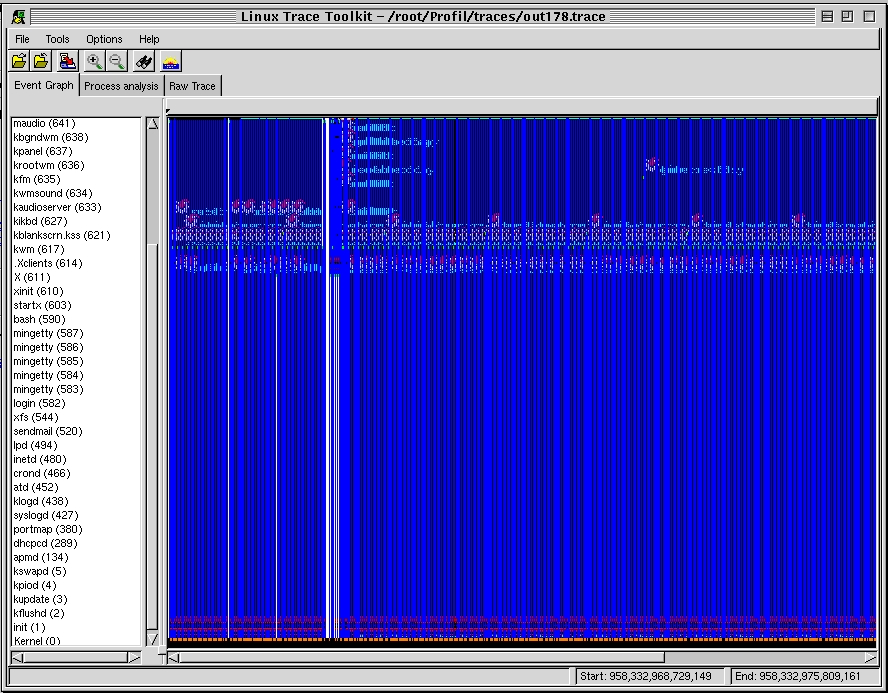
In order to help the user concentrate on a group of events
or view many events in the same time, zoom in and zoom out functionality is
provided. And since it is not always clear to which process an execution period
belongs (green line), a horizon grid can be used that starts at the height of
every process at the begining of the displayed trace to the end of it. Horizon
lines are displayed in yellow. The following screenshots provide examples to
illustrate the discussed concepts.
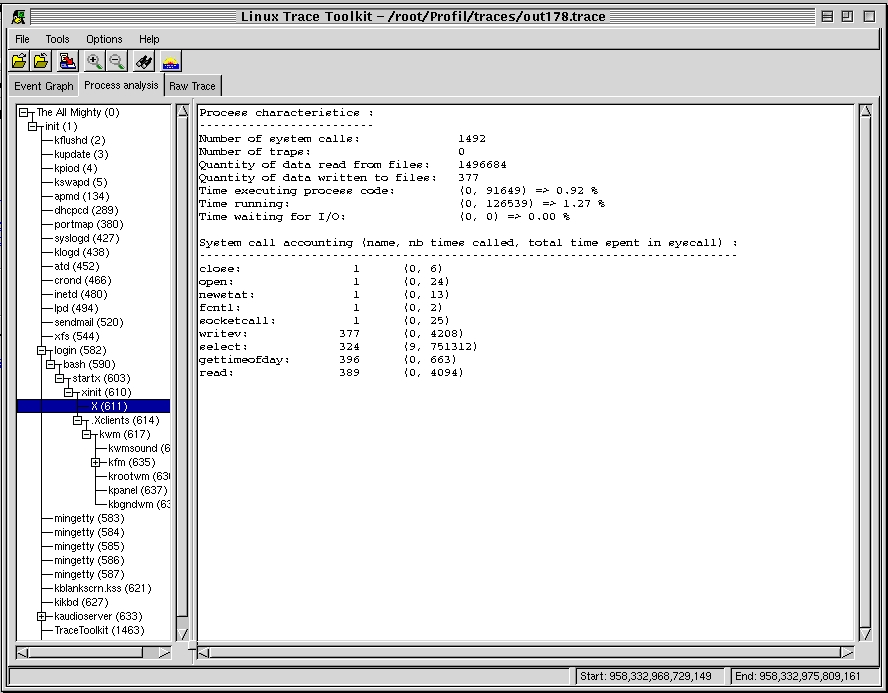
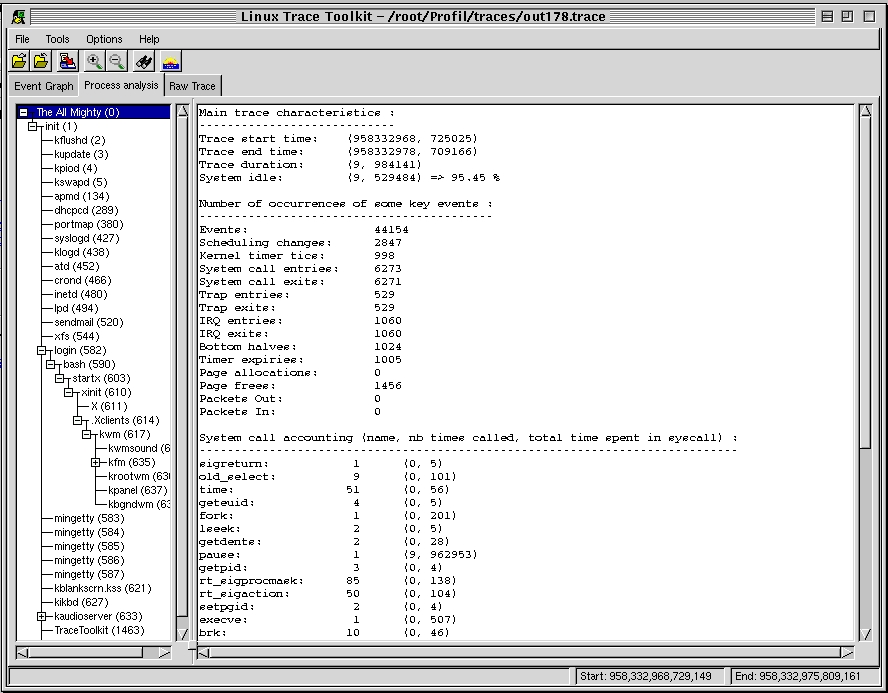
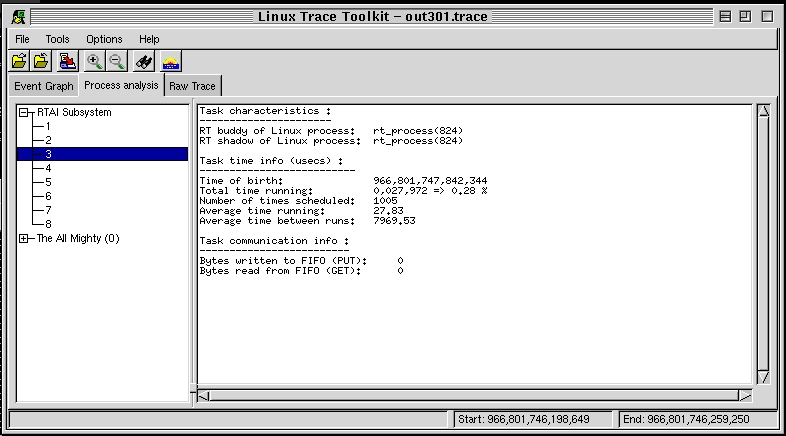
The process analysis thumbnail provides the user with an in-depth analysis of every process that existed during the course of the trace. The items displayed are the same for all the processes except process 0 (idle) which is called 'The All Mighty' and is used to display the summurized information about the whole system.
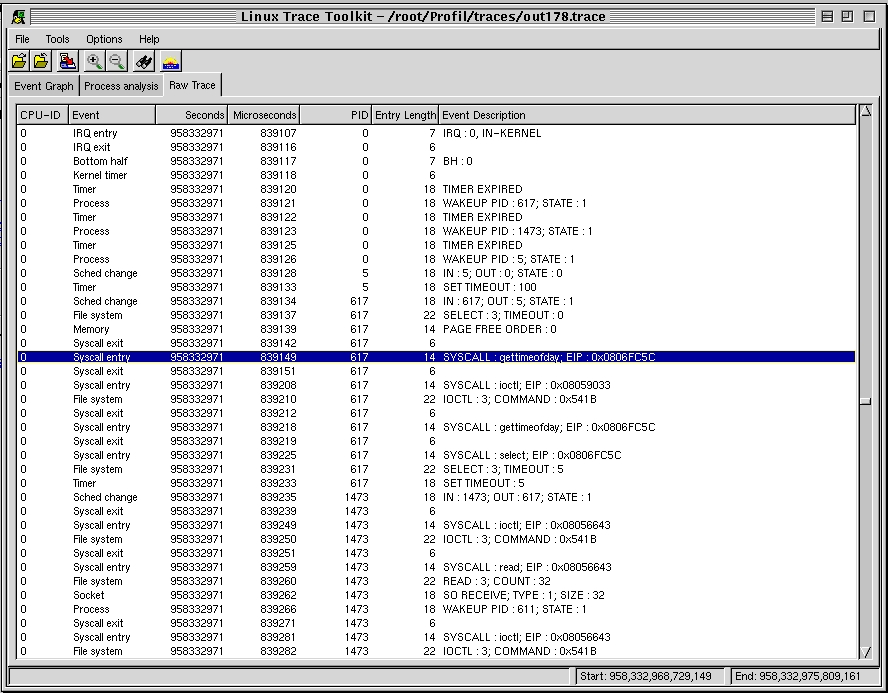
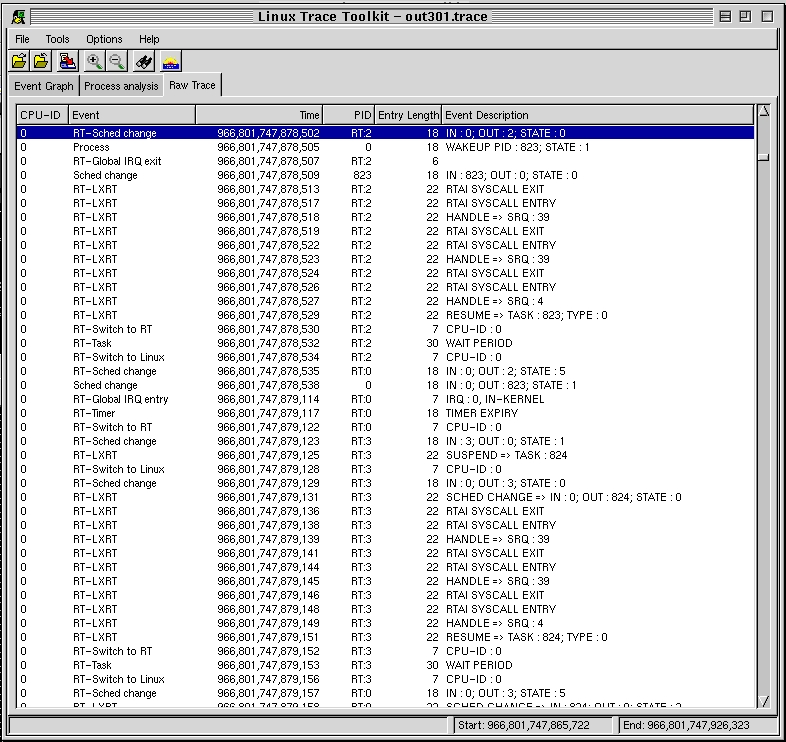
The raw list of events is, as its name says, the raw list of events that occured during the period of the trace. All the events are listed with the exact time at which they occurred, the PID of the process to which they belonged, the amount of space occupied by the event in the trace module in the kernel and the string accompanying the event, if any.